Introduction to in situ visualization and ParaView Catalyst
Note: This article was written for PRACE Summer of HPC blog as a part of my internship. You can find the original posts here and here.
Introduction
Traditionally, the process of performing numerical simulations consists of three separate steps: First, the input parameters (such as initial or boundary conditions) are specified, then the simulation is executed and finally, in order to determine the result, it is necessary to explore and analyse generated data. For several decades, increasing power of computer clusters and advancement in parallel computing methods allow scientists to perform more and more accurate simulations in various fields of human research.
On the other hand, increasing demands of the simulations need more data to be stored on a disk and analysed. However, the capabilities of computing environment which is responsible for transferring the data and communication have not grown up as rapid as the computational power. Dumping and processing of all the data calculated during the simulation would take too much time, so in practice this usually means that they are stored only at several time-steps or at much coarser resolution than the original data. The rest is just discarded and the significant part of information may be potentially lost.
What is in situ visualization?
In situ visualization stands for the technique, where the data are visualized in real-time, as it is being produced by simulation, and without involving storage resources. By using the visualization and simulation together, one can overcome the bottleneck of data transfer. Furthermore, this approach allows to monitor and interact with running simulation, so its parameters can be modified and scientist can immediately see the effect on investigating phenomena.
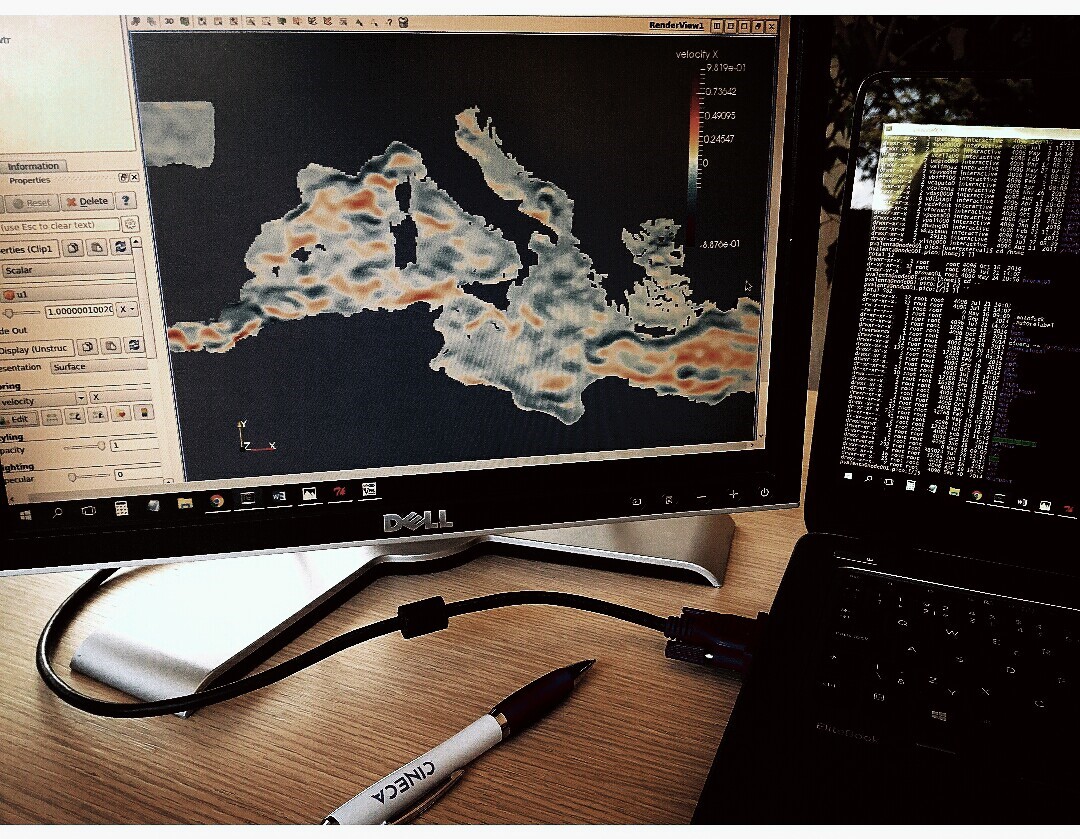
Researchers in OGS (National Institute of Oceanography and Experimental Geophysics) use a 3D numerical model OGSTM–BFM to study the nutrient and carbon cycles in the Mediterranean Sea and their sensitivity to climatic changes. The model computes biogeochemical fluxes which transform organic and inorganic components. Recent requirement of increasing the spatial and temporal scales of the simulations encounters aforementioned problems, thus the computation time is longer and it becomes very difficult to analyse produced data.
During the two months stay at CINECA supercomputing centre, I will be involved in a development of the 3D in situ visualization tool, which can be used to check and analyse the OGSTM–BFM model behaviour by consistently evaluating how the biogeochemical processes are influenced by the nutrient and carbon cycles, specifically related to the three main boundary conditions: the Atlantic inflow at Gibraltar Strait, the terrestrial inputs at rivers and the atmospheric deposition. The tool will be also beneficial to control the correctness of the computations during the simulation runtime. The implementation should be designed in such a way that allows portability to other coupled modelling systems used at OGS for many different purposes.
In general, in situ visualization creates an opportunity to explore and analyse much more data than is possible with traditional techniques. Also, as high performance computing moves towards the exascale era, in situ approach is widely predicted to become more and more important as an efficient tool for speed-up of large scale simulations.
How to instrument my code?
Warning: Since version 5.9 the Catalyst API has changed significantly and the information in this article might be no longer valid. The latest Catalyst docs are available here.
Recently, there has already been done a significant work in the development of several in situ solutions that can be directly embedded into the simulation code, so there is no need to rewrite it from scratch. Here I will look closer on ParaView, a popular multi-platform scientific data analysis and visualization environment which is distributed under an open source license. While demonstrating its qualities in post-processing of extremely large datasets for a long time, thanks to Catalyst library ParaView now also belongs among currently available in situ visualization tools.
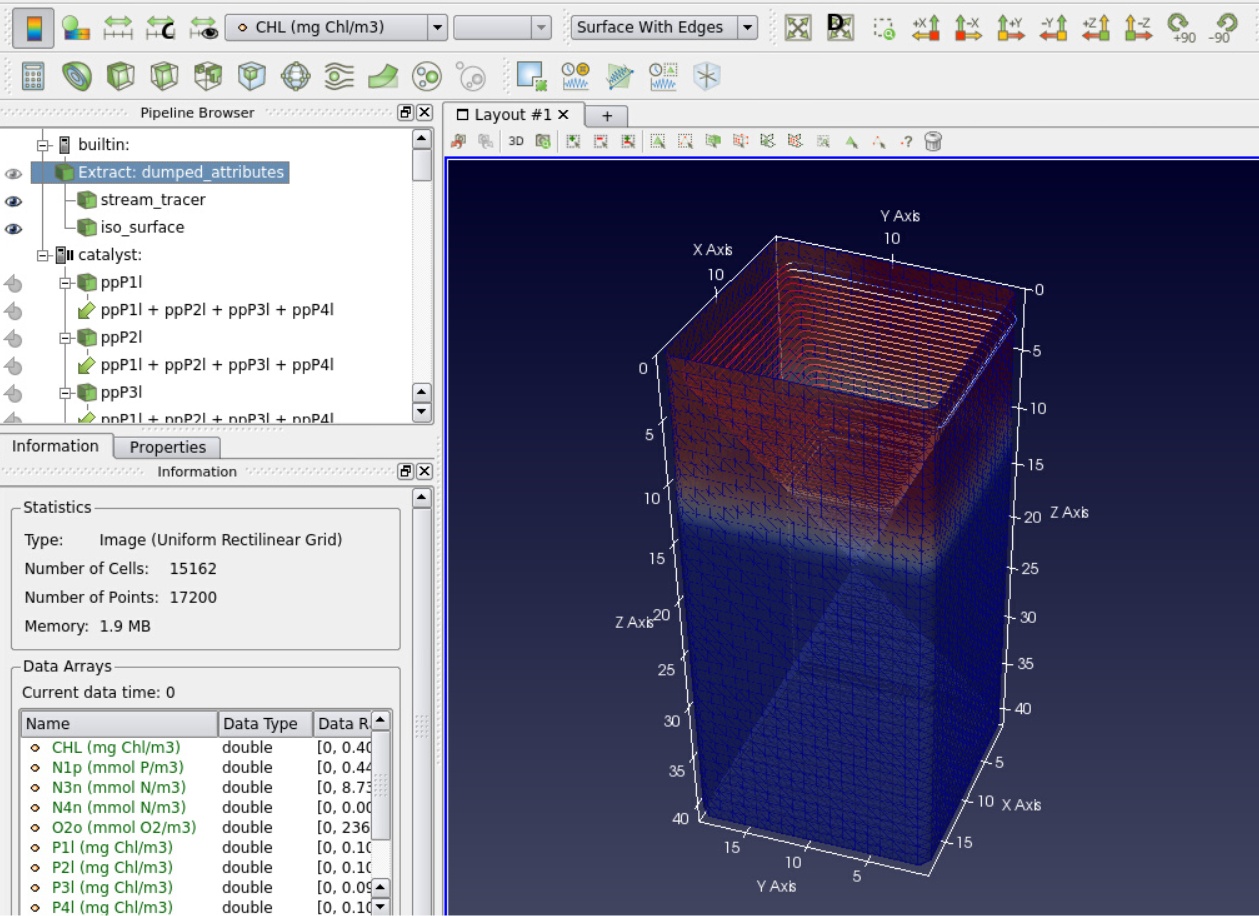
Catalyst, a relatively new component of ParaView, has been designed for fast integration with numerical codes and performing real-time analysis of generated data. It changes the traditional three-step simulation workflow. Here you first specify, which data you would like to see and analyse in situ. For this reason Catalyst uses a pipelines that are executed during the initial phase of the numerical simulation. In these pipelines, you can utilize all the post-processing capabilities which ParaView offers. In other words, you select the data which simulation produce, then apply filters such as slices, streamlines or iso-surfaces and finally choose what should be dumped for deeper investigation. This way, the output can be significantly reduced because the processed elements, which carry all the information you are interested in, are much smaller than the full datasets.
Adaptors and pipelines
Since ParaView is built on the standard visualization toolkit VTK, the simulation internal data structures have to be transferred into the VTK data structures. This is done via so called adaptors. Adaptor is a simulation interface, which should be separated from the code, in order not to disturb it and simplify build process. At the end of the day, you have to call only three functions of the adaptor from the original code. The first one, which is called only once per simulation run, initializes Catalyst and loads pre-configured pipelines. The second one creates VTK grids, appends the computed attributes on it and dumps selected elements with frequency specified by the user. And the last function is used at the end of the simulation to release all Catalyst resources.
Once you finish the procedure specified above and instrument your code with Catalyst, it is time to run the simulation. First you should run pvserver, a component which represents the server on which ParaView is running and process all the data. Then you can connect to that server with ParaView client and control the visualization remotely from your local machine or using visualization nodes of a supercomputer. The main advantage of doing this is that pvserver can be executed in parallel, so with enough resources you can smoothly explore even extremely large datasets. Via ParaView client you can then connect to Catalyst with port number specified in the pipelines. Once you are connected, the pvserver waits for the simulation data. The last step is to execute the simulation. Notice that the order is not important, there is no problem of connecting to already running jobs.
Real-time data exploration
During the simulation, user can see the size of the datasets that simulation produces. But by default, none of the data is available on the server. The computationally expensive operations are done only on user’s demand via ParaView graphical interface. So the user can select data structures and analyse them the same way as via post-processing. But there is one difference: the simulation is running so user can observe the data as it is being generated. With Catalyst, it is also possible to pause the simulation or specify a break-point at selected time step. This can be helpful if you expect some interesting behaviour of investigated phenomena or for identifying of regions, where the numerical instability arises.
In summary, ParaView Catalyst is easy to integrate with already existing simulation code and offers really deep insight into the large amount of data corresponding to the simulated phenomena. If your code spends too much time for dumping generated data or if you contend with insufficient storage resources, ParaView Catalyst could be an elegant solution. In addition, in situ visualization is expected to enable a wide range of new interactive applications in future.