In situ visualization of laser-plasma interaction
Note: This work was presented at ISC High Performance 2018 conference in the form of a project poster.
Introduction
Thorough understanding of ultra-intense laser-plasma interaction may enable new routes in fundamental research as well as a wide range of applications [1]. However, this field of physics involves collective behavior of particles in self-consistent electromagnetic fields which is, in general, complex and strongly non-linear problem that can be investigated only with the help of large-scale computer simulations. An exponential increase of computational throughput of supercomputers enables researchers to perform simulations with unprecedented accuracy. Using the conventional post-processing approach of data analysis, such simulations would require extremely large amount of data to be stored on a persistent storage. The storage bandwidth performance, however, has not grown up as rapidly as the computational power. In practice, the data coming from the simulations have to be stored only at several time-steps or at much coarser resolution than the original data, the rest is just discarded. Therefore, a significant part of information may be potentially lost.
The technique where the simulation data are concurrently analyzed and visualized while it is being generated is usually referred to as in situ processing. In situ processing could circumvent the bottleneck of data transfer. By coupling the visualization and simulation together, one may process and analyze the simulation data at high spatial and temporal resolutions without the necessity of involving the storage resources. Recently, we have instrumented the code EPOCH [2] with the ParaView Catalyst [3]. EPOCH is massively parallel, multi-dimensional plasma physics simulation code based on the particle-in-cell (PIC) method. ParaView Catalyst is a library that has been designed for in situ coupling of numerical codes with the state-of-the-art visualization system. Here we present our implementation strategy, performance analyses and demonstrate the in situ capabilities on several large-scale laser-plasma simulations.
Note: A short introduction to in situ visualization and ParaView Catalyst can be found also in my previous post
Implementation details
Warning: Since version 5.9 the Catalyst API has changed significantly and the information in this article might be no longer valid. The latest Catalyst docs are available here.
The effect of in situ analysis on the PIC codes has been extensively studied before [4]. Within this work, the EPOCH code has been coupled with ParaView Catalyst via so-called adaptor. Adaptor is a simulation interface, which should be separated from the main code in order not to disturb it and to simplify the build process. The EPOCH adaptor uses Catalyst C++ application programming interface to implement the following three methods:
The first method, which is called at the initial phase of the simulation, initializes Catalyst input channels and loads preconfigured visualization pipelines. There are multiple input channels provided. One channel is reserved for the underlying Cartesian grid, on which all the field quantities are calculated. Other channels are reserved for particles and their number depends on how many particle species the simulation involves. This approach ensures that the Catalyst pipelines can output results based on the field information only, on particular particle species information only, or on arbitrary combination of inputs.
The visualization pipelines decide what operations to perform on the data and how to output desired results. In these pipelines, one can benefit from all the post-processing capabilities that ParaView offers. They may also contain the IP address and the port number of the ParaView server if the user wants to enable so-called live visualization. The pipeline may be hard coded or in the form of a Python script that can be generated using the ParaView graphical user interface (GUI).
The second method, which is called at each simulation time-step, builds all the necessary data structures and invokes the data processing specified in loaded pipelines. Since the ParaView is built on the standard visualization toolkit VTK [5], the simulation internal data structures have to be mapped onto the VTK data structures. The Cartesian computational grid and its decomposition including ghost cells are represented by vtkMultiBlockDataSet and vtkRectilinearGrid, respectively. Each particle species is represented by distributed vtkUnstructuredGrid containing only points and VTK_VERTEX cells that index them. VTK data structures have to be recalculated only when the local domain changes (e.g., when a particle crosses the boundary of the domain or when the domains are restructured by a load-balancing algorithm).
The Cartesian grid contains three field quantities – the electric field vector, the magnetic field vector, and the current density vector. To avoid deep-copying of arrays from the simulation data structures, the adaptor takes advantage of the structure-of-arrays memory layout using the vtkSOADataArrayTemplate class. This ensures that the adaptor will efficiently reuse the simulation memory and only a negligible amount of additional memory is allocated for creating VTK data structures. Each particle contains the vector of its position that is linked with one vertex of the corresponding unstructured grid. In addition, the particle contains vector of its momentum and weight, which is a scalar quantity that determines how many real particles it represents.
The last method is used at the end of the simulation to release all the Catalyst resources. All three methods are then incorporated to the main code using preprocessor directives.
Tip: The source code of the implemented EPOCH adaptor to Catalyst as well as sample visualization pipelines can be found in this GitHub repository.
Performance analysis
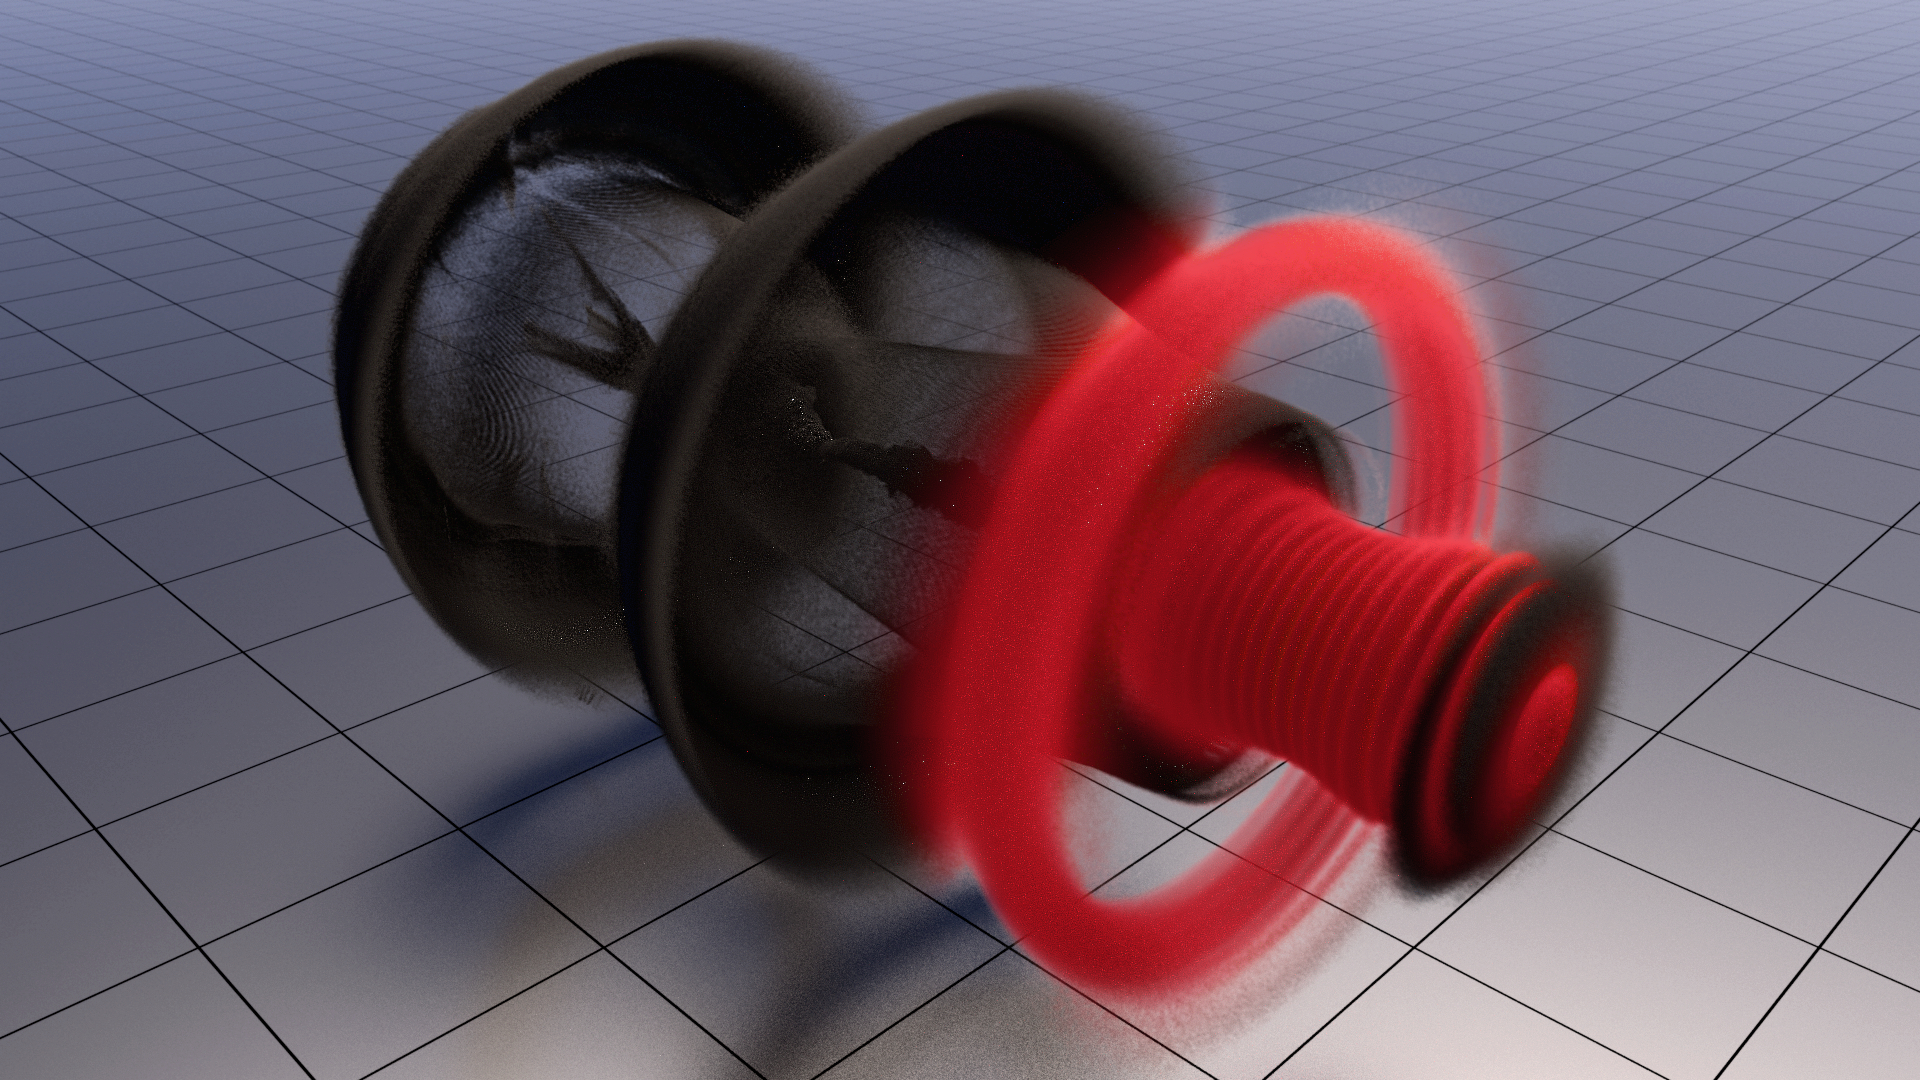
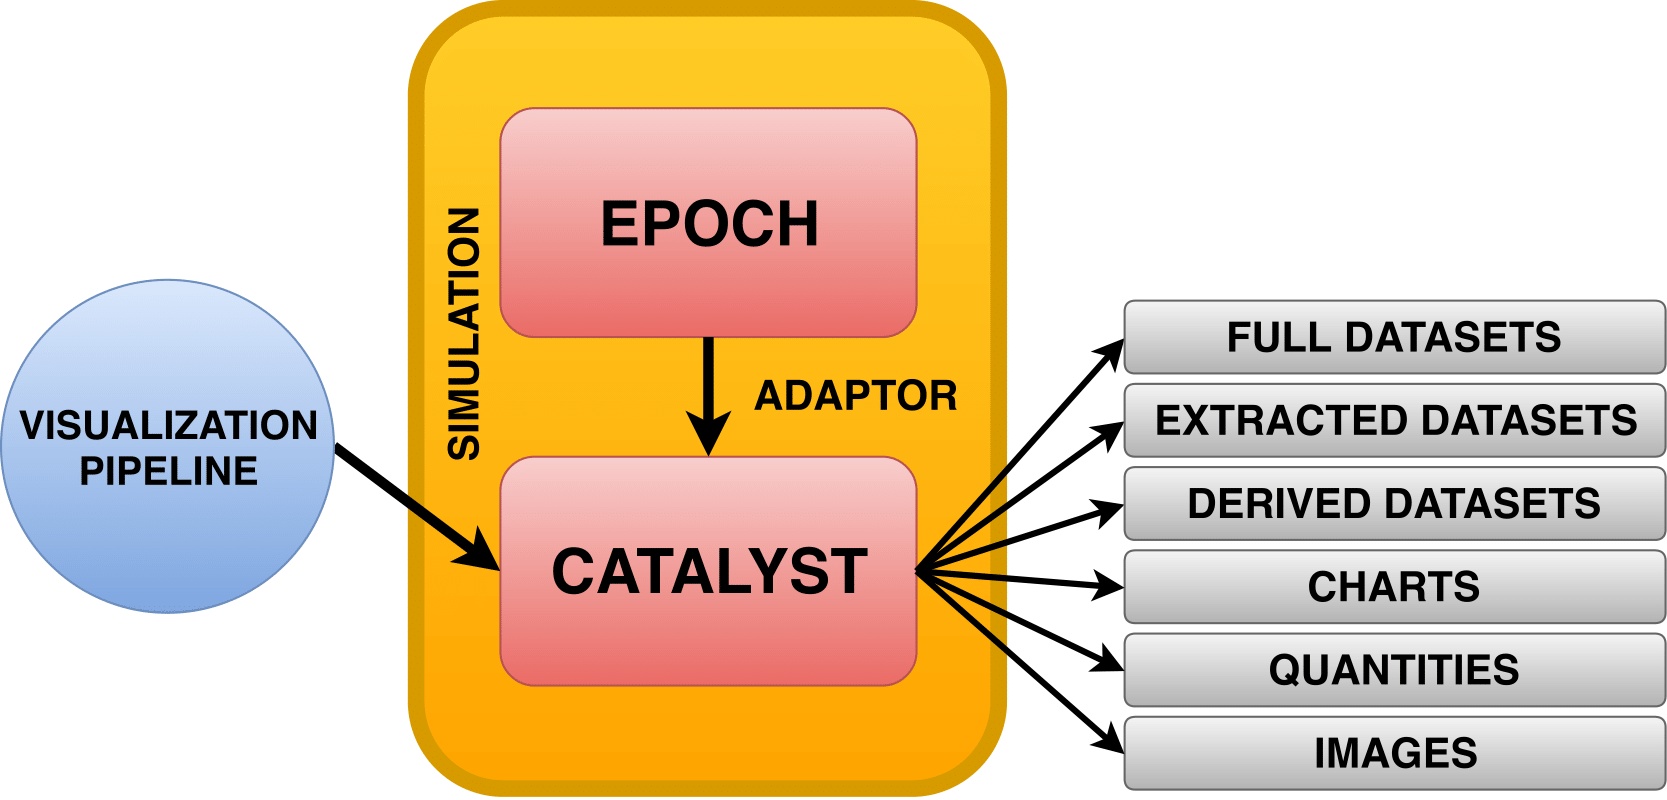
The EPOCH code instrumented with Catalyst benefits from various new capabilities. It can produce a wide range of outputs (see Fig. 1):
- Full datasets
- Extracted datasets (slices, iso-surfaces, etc.)
- Derived datasets (streamlines, vector fields, etc.)
- Charts (plots along a line, histograms, etc.)
- Quantities (minimum or maximum values, etc.)
- Images
All these operations are prescribed in the visualization pipelines and executed only at user defined intervals or in response to specific conditions or events in the simulation. Analysis and visualization is then performed in place and in parallel, which results in a much shorter time to gain insight into the investigated phenomena than using conventional approaches.
In addition, the code can be run in two main modes of operation – batch mode and interactive mode. In the batch mode, the code executes the visualization pipelines automatically. In the interactive mode, the user can connect to Catalyst using the ParaView GUI and control the simulation. Since the user can interactively explore the data as they are being generated, this provides an invaluable tool for scientific insight as well as for debugging of simulation codes. Both two modes can be run simultaneously.
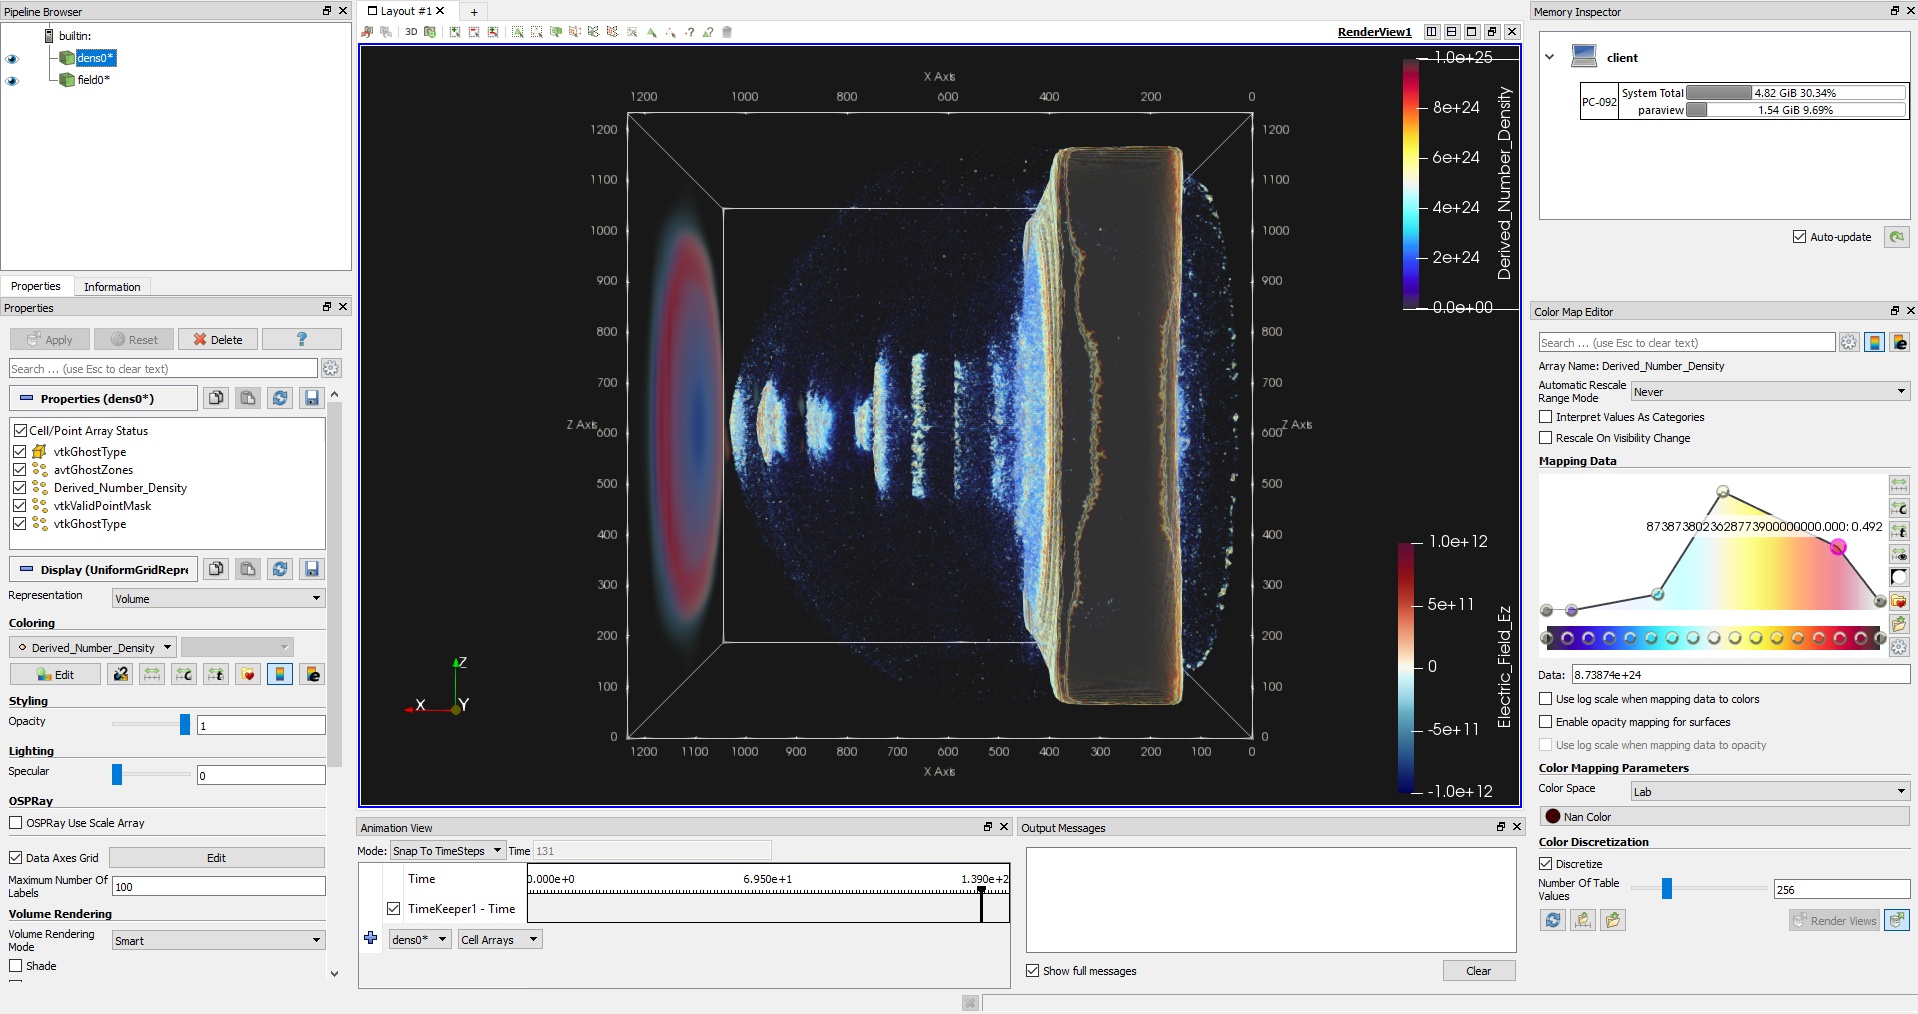
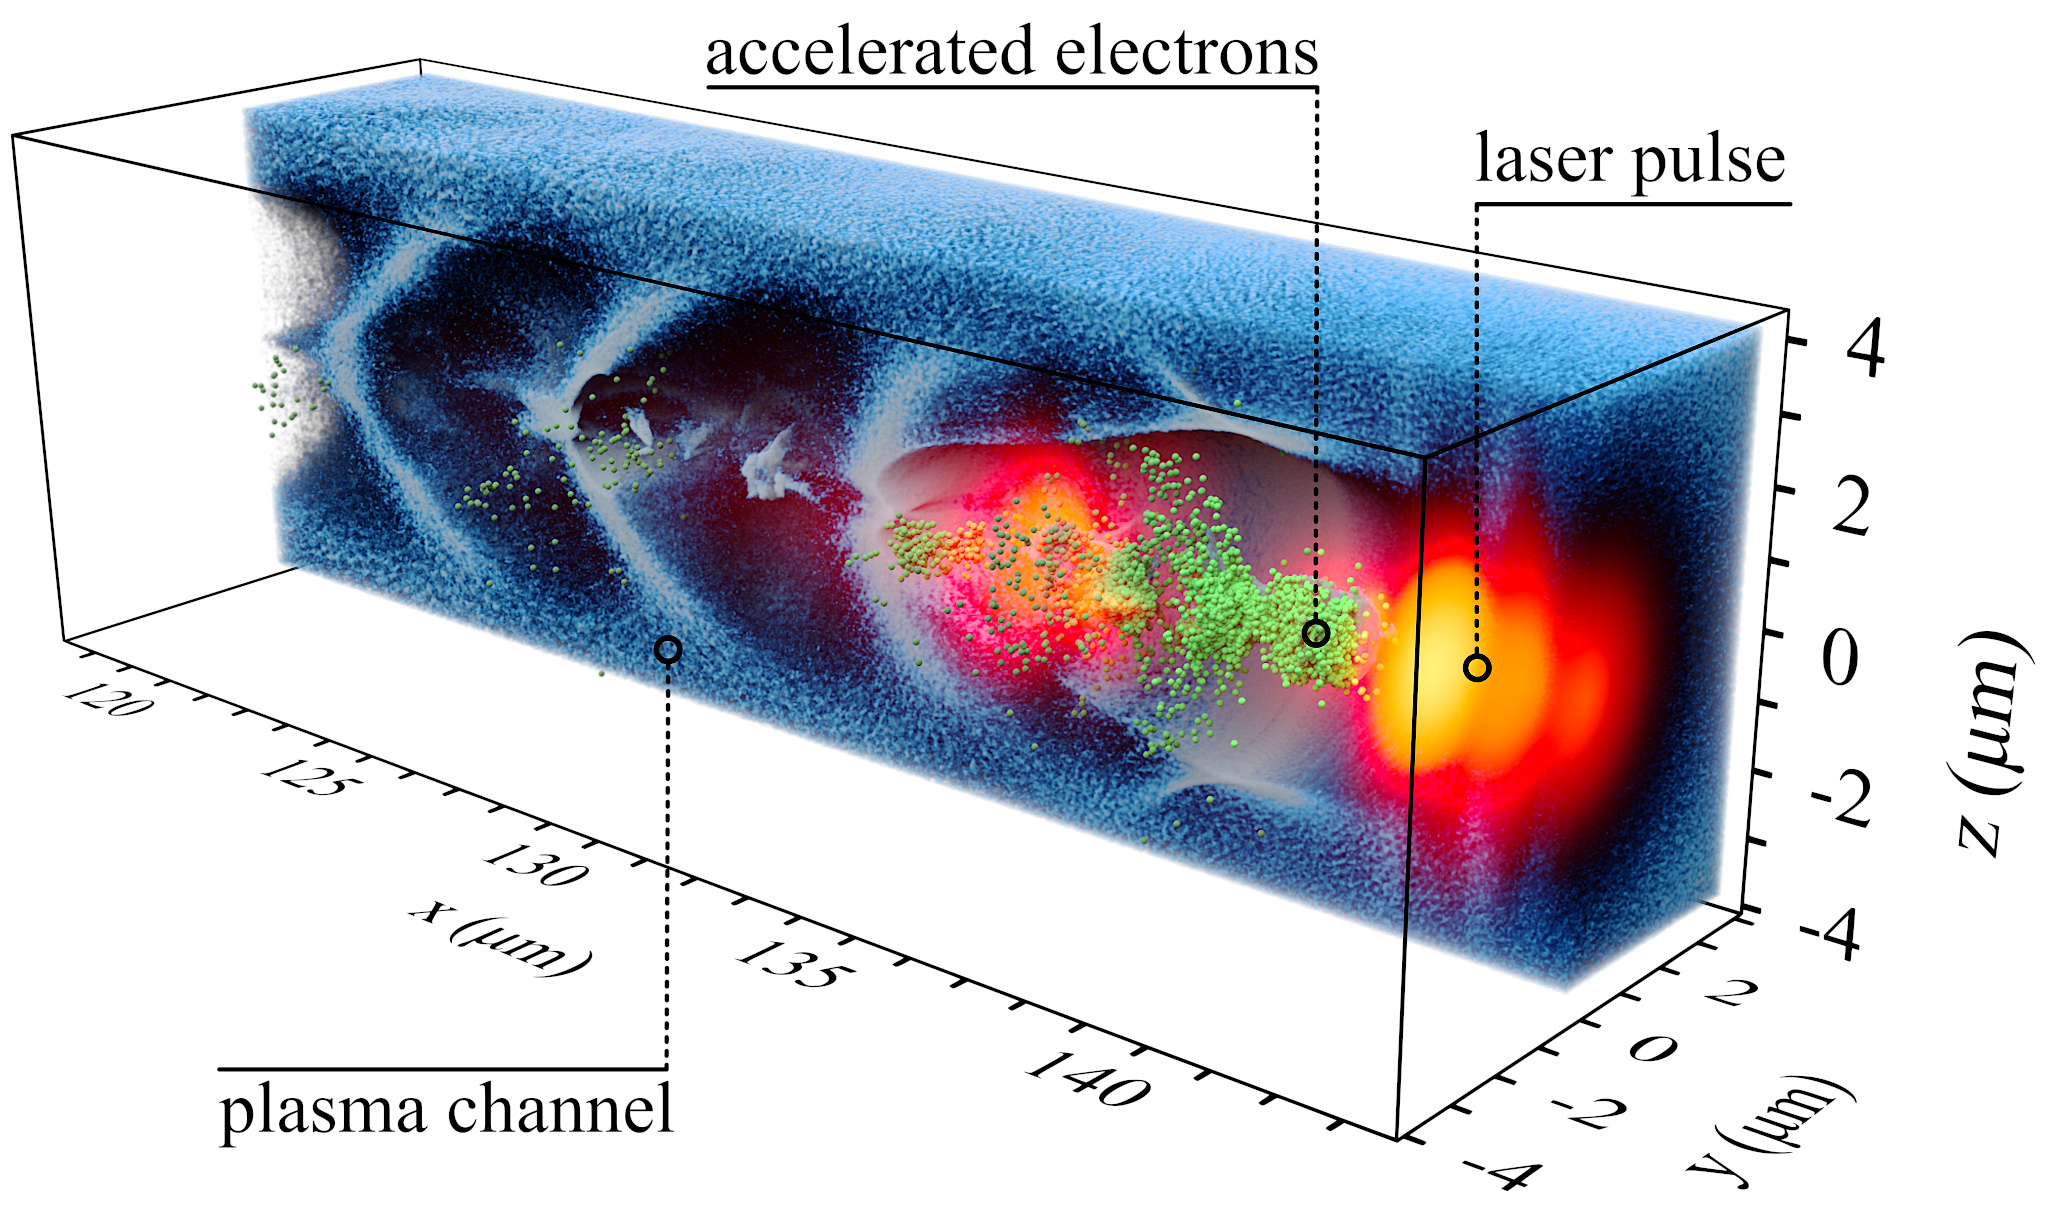
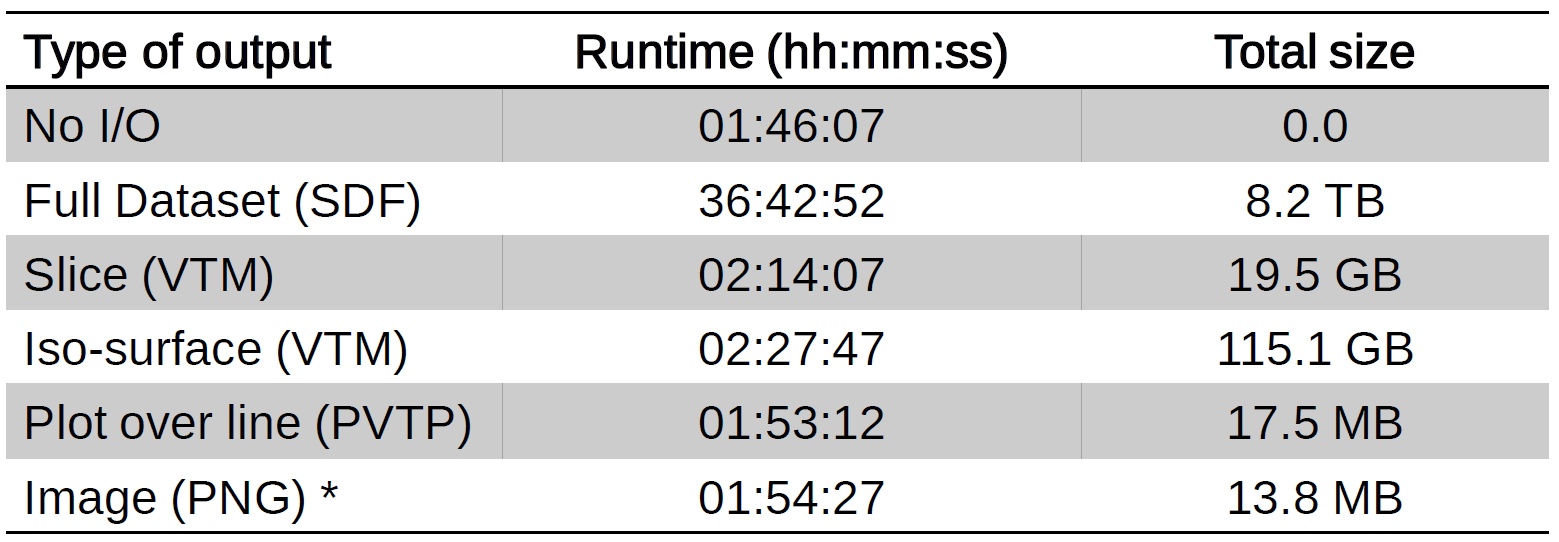
We analyze the performance of the instrumented code in terms of the compute time and the I/O cost for certain operations on a test three-dimensional simulation (see Fig. 2). Then we compare the results with the identical simulation run which outputs the data that would have to be stored for the same analysis using conventional post-processing approach. The simulation dumps all three field quantities at relatively high frequency (each tenth iteration out of 2100) and in double precision. All the test simulations were executed on 16 nodes of a computer cluster, where each node contains 16 Haswell-EP cores and 128 GB DDR4 RAM. The nodes of the cluster are interconnected by a fully non-blocking fat-tree Infiniband QDR network, with 40 Gbps bandwidth. The storage bandwidth performance is approx. 1.8 GB/s.
The results are shown in Fig. 3. As can be clearly seen, the simulation spends approx. 95 % of the total time on I/O operations and requires around 8.2 TB of disk space in the case of dumping whole datasets for post-processing. On the other hand, the ratio between computation and I/O operations regarding the individual Catalyst filters is much more reasonable. Therefore, using the right visualization pipelines to extract the features of interest, one can drastically reduce the I/O and speed-up the simulation.
In situ visualization is expected to enable a wide range of new interactive applications in the near future. In addition, as high-performance computing moves towards the exascale era, in situ approach is widely predicted to become an indispensable tool for speed-up of large-scale simulations and more efficient use of modern supercomputing resources [6].
References
[1] G. A. Mourou, T. Tajima, and S. V. Bulanov, Rev. Mod. Phys. 78, 309 (2006).
[2] T. D. Arber et al., Plasma Phys. Control. Fusion 57, 11 (2015).
[3] A. C. Bauer, B. Geveciand, and W. Schroeder, ParaView Catalyst User’s Guide, Kitware, Inc. (2017).
[4] O. Rubel et al., IEEE Computer Graphics and Applications 36, 3 (2016).
[5] W. Schroeder, K. Martin, and B. Lorensen, The Visualization Toolkit: An Object-Oriented Approach to 3D Graphics, 4th Edition, Kitware, Inc. (2006).
[6] E. W. Bethel, H. Childs, and C. Hansen, High Performance Visualization: Enabling Extreme-Scale Scientific Insight, Chapman & Hall / CRC (2012).